If you’ve ever watched a stock break out only to pull back and leave you second-guessing your entry, you’re not alone—every trader has been there. Timing the perfect entry after a breakout can feel like a daunting task, especially for beginners.
What if you could turn that pullback into a golden opportunity, using a simple strategy that boosts your confidence and stacks the odds in your favor for catching the next big move?
In this article, we’ll explore the Breakout Backtest strategy – a beginner-friendly approach to trading that helps you capitalize on pullbacks after a breakout. Building on our previous analysis of bullish engulfing candles, we’ll cover how stocks like TSLA, COIN, BTDR, and ARKK are now backtesting key levels after their recent breakouts, offering prime setups for traders across various timeframes.

Download the Blueprint on Skool
If you don’t have a copy yet, consider downloading my free 6 Month Blueprint. Find Blueprints and free courses in our Skool Community
What is the Breakout and Backtest Strategy?
The Breakout Backtest strategy is a straightforward yet powerful trading approach that focuses on two key phases: the breakout and the subsequent pullback (or backtest).
A breakout occurs when a stock’s price decisively moves above a significant resistance level—such as a moving average, Fibonacci level, or Ichimoku Cloud component—signaling potential for an upward trend.
The backtest happens when the price pulls back to retest that newly broken level, which often acts as support, before continuing its upward move.
This strategy is ideal for beginners because it provides a clear entry point with a defined risk-reward setup. While this article examines weekly chart backtests following bullish engulfing candles, the strategy is adaptable across various timeframes, making it useful for day traders, swing traders, and momentum traders.

Key Characteristics:
- Breakout: The stock price surges above a key resistance level, often accompanied by high volume or a strong candlestick pattern like a bullish engulfing candle.
- Backtest: After the breakout, the price pulls back to test the broken resistance level, which now acts as support, confirming the breakout’s validity.
- Entry Point: Traders enter a long position when price retraces back to a support level.
- Timeframes: This strategy is analyzed here on weekly charts, however breakouts on shorter timelines can work as well.
Why It Matters:
The Breakout Backtest strategy is effective because it leverages the natural ebb and flow of the market. Breakouts often attract attention, but the subsequent pullback can shake out weak hands, offering disciplined traders a low-risk entry point.
When the backtest occurs at key technical levels—like moving averages, Fibonacci retracements, or Ichimoku Cloud components—it increases the probability of a successful trade.
Backtests of this strategy, especially on weekly charts, often reveal reliable entry points for traders.
Stock Analysis: Backtesting After Bullish Engulfing Breakouts
In our previous article on bullish engulfing candles, we highlighted how these candles signaled strong breakouts in stocks like TSLA, COIN, BTDR, and ARKK, as they blasted through multiple resistance levels on their weekly closes. Now, these stocks are pulling back to backtest those key levels, offering potential entry points using the Breakout Backtest strategy. Below, we analyze each stock’s current setup on their weekly charts, but traders can apply this approach to daily or intraday charts for day trading or swing trading opportunities.
TSLA
Tesla, Inc. (TSLA) surged with a bullish engulfing weekly candle, breaking through the 0.618 and 0.71 Fibonacci retracement levels, key Gann levels, the 200-week, 100-week, and 50-week SMAs, the Ichimoku conversion line, and the top of the cloud. Currently, TSLA is backtesting the 50-week SMA and the Ichimoku conversion line on its weekly chart. This backtest at a critical support zone suggests TSLA may be gearing up for another leg higher, making it a prime candidate for this strategy.

COIN
Coinbase Global, Inc. (COIN) broke out with a bullish engulfing weekly candle, slicing through the 100-week SMA, the Ichimoku Cloud, the conversion line, and the 0.702 Fibonacci retracement level. Now, COIN is backtesting the 100-week SMA and the 0.702 Fibonacci level on its weekly chart. This pullback to a strong support area indicates a potential buying opportunity, as COIN could see renewed bullish momentum if the backtest holds.

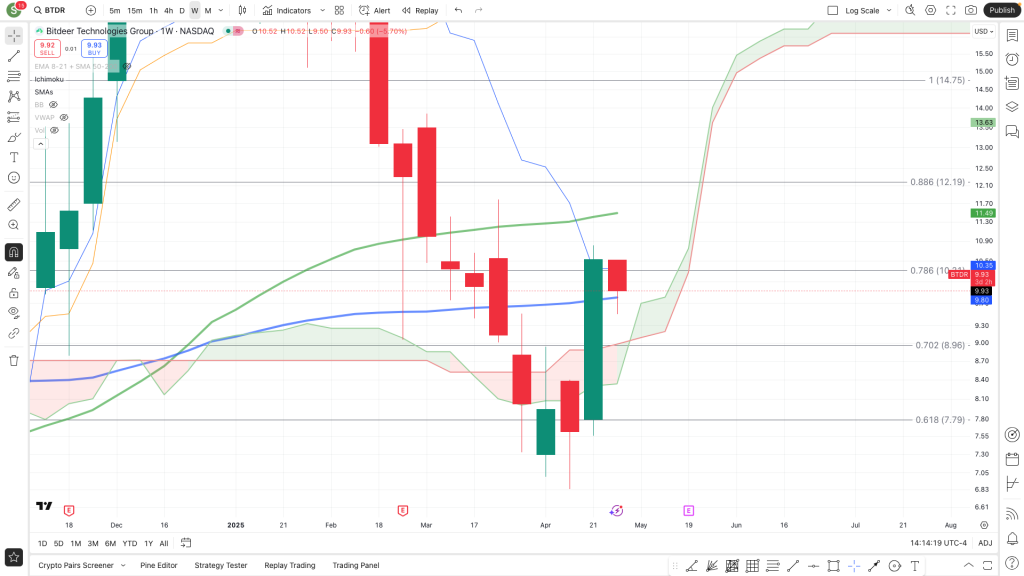
BTDR
Bitdeer Technologies Group (BTDR) powered through the Ichimoku Cloud, the conversion line, and the 100-week SMA with a bullish engulfing weekly candle. On its weekly chart, BTDR is now backtesting the 100-week SMA and the Ichimoku Cloud’s upper boundary. This backtest at a key support zone offers traders a chance to enter with defined risk, as a successful hold could propel BTDR higher in the tech and blockchain sector.
ARKK
The ARK Innovation ETF (ARKK) broke out with a bullish engulfing weekly candle, moving through the Ichimoku Cloud, the 100-week and 50-week SMAs, the conversion line, and several Gann levels. Currently, ARKK is backtesting the 50-week SMA and the Ichimoku Cloud on its weekly chart. This pullback to a confluence of support levels suggests that ARKK could be setting the stage for further gains, particularly for growth stocks, if the backtest confirms support.

Conclusion
The Breakout and Backtest strategy is a simple yet effective tool for beginners looking to navigate the stock market with confidence, whether on weekly charts or shorter timeframes like daily or intraday setups. Following their bullish engulfing candle breakouts, stocks like QQQ, TSLA, COIN, BTDR, and ARKK are now backtesting key levels on their weekly charts, presenting high-probability opportunities for traders. By combining this strategy with technical indicators like moving averages, Fibonacci levels, Gann angles, and the Ichimoku Cloud, you can pinpoint optimal entry points with clarity. Day traders can adapt this approach for rapid intraday trades, while swing traders can use it for multi-day or multi-week holds. As always, backtesting your setups and practicing sound risk management are crucial to success. Keep a close eye on these stocks, as their current backtests suggest they could be gearing up for the next big move—offering a perfect chance to ride the momentum.
